Grafana Dashboards
Posted 2026-08-01
A few months ago I build a tool to make it easy for me to track a bunch of disparate data. Basically you define buckets, and you put any old numeric value in them. I have one for each of the major numeric things I want to track: weight, steps, and sleep score. I started tracking these ultimately because I wanted to see how these things affect eachother, and what trends they have, together, over time.
So far, I have the data collection, but I can’t view them. I could add a panel in the app next to the calendar that shows me metrics about the data in that bucket, but like I said I wante to be able to correlate data.
Enter Grafana.
I understand that Grafana is a powerful tool, and the possiblities are endless. Most of the time, I value learning things. A big part of what makes getting to an outcome rewarding is the process of getting there. Part of why I struggle with AI is that it moves faster than I can understand it. I’m left with an incomprehensible outcome, and I’m locked to the AI if I ever want to make further updates.
This, however, is not one of those things.
I have a handful of services running in Docker on a leftover Mac Mini in my basement. My prompt to Claude was
In the Carcinization1 project there is a concept of buckets wich hold numeric data over a timeseriese. I would like to add a graphana instance which allows for viewing that data, starting with bucket id cmq4hs02f0011pi013db9fnur2. I’d like for the dashboard to feature two cells in the first row. The first cell is the average value, and the second one is the number of times in the timeframe that I’ve reached my goal of 10k. The second row should show the data over time with a trendline.
From there, there were a few iterations. For example, it started with a line chart when for this I really wanted a bar chart. The end result was a config file living in homelab/grafana/provisioning/dashboards/steps.json which renders this dashboard:
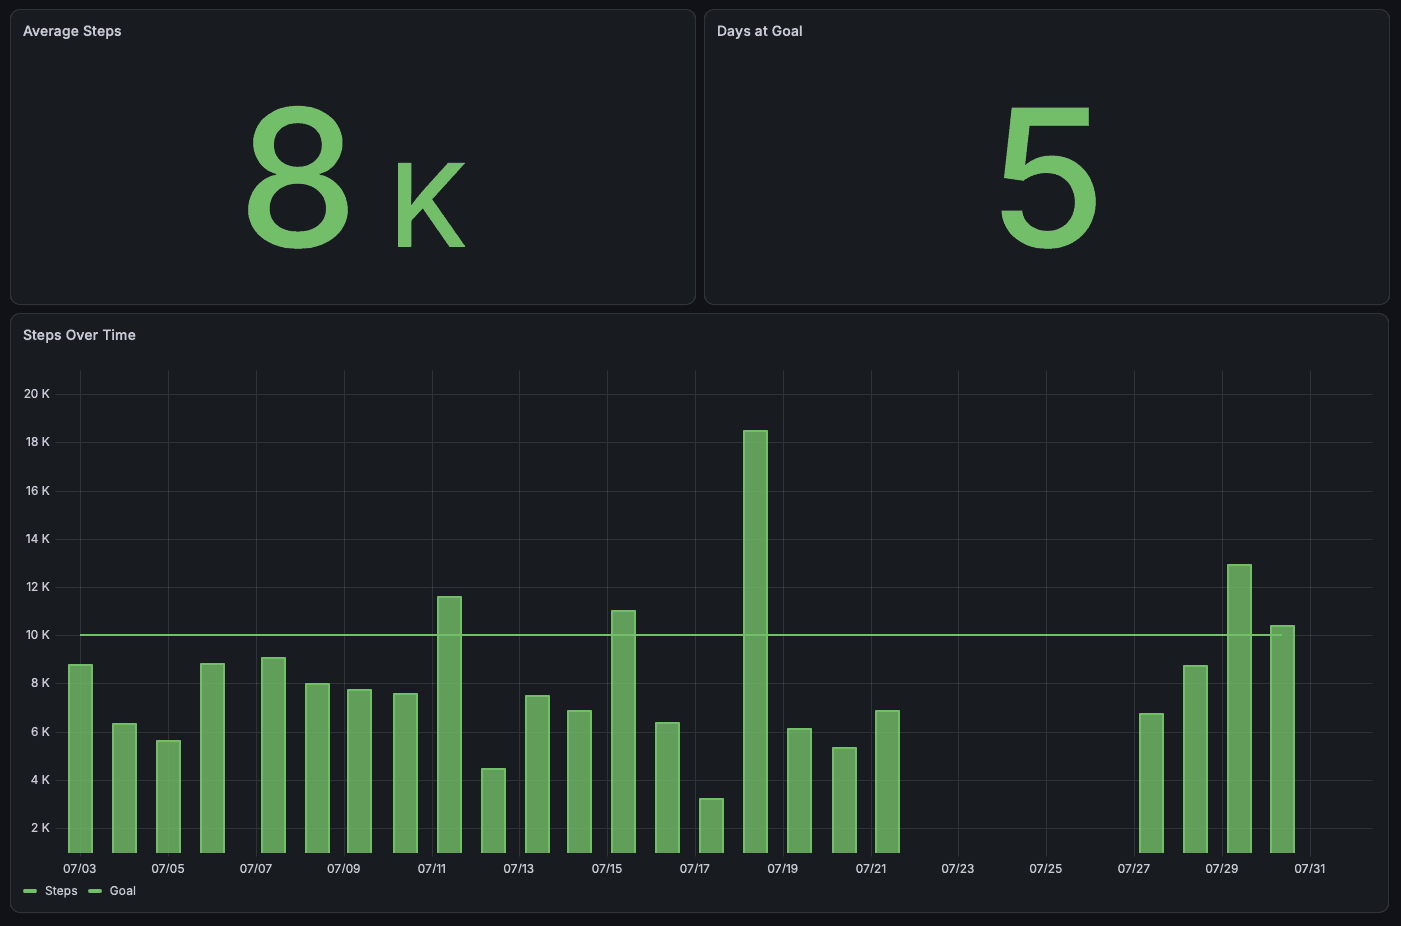
I have similar files and dashboards for each of the other metrics. There’s a few other kinds of data I want to try and collect before I start making aggregate dashboards, but this is the next step in that direction.
Footnotes
-
Carcinization is the name of the “super app” running in my homelab that hosts the the buckets database and forms, plus a variety of other web tools.
-
This is the ID for the steps bucket.